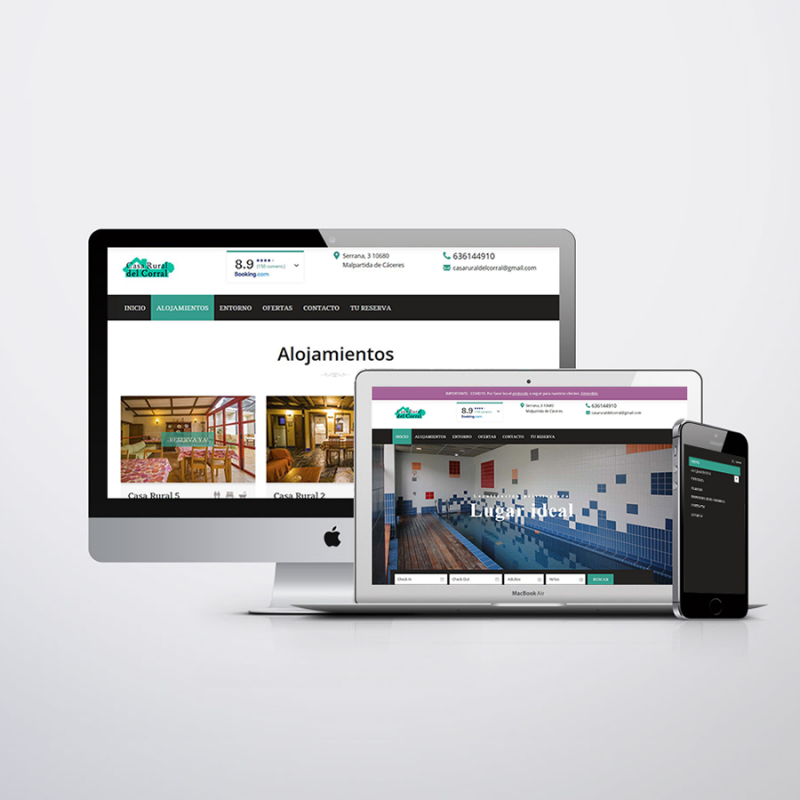
The owner of a Tourist Service Company based in Monfrague National Park, asked for help in relation to one of his businesses, a complex of rustic houses and apartments that was advertised for let.
In the last few years, the company has lost profitability as commercial websites like Booking.com have forced them to offer bookings by bedroom, not by house or apartment. They think that one of their problems is their existing website.
Until now they have always left the decisions of the design and development of their website to traditional waterfall development companies, which focus their attention in designing the website around agreed requirements upfront and SEO, and do not offer iterative development informed by User Research.
After a quick look at the website, I found some potential problems in information architecture and interaction design. Despite a little insecurity at the start and some hours of deep discussion about the importance of User Research, I convinced the client to approach the project from a User Centred Design perspective.
OBJECTIVES
To be able to do User research in every step of the process is a big opportunity to develop my knowledge as User Researcher. This and the initial full support of the company encouraged me to accept this project.
However, I have to admit there were some challenges in the project:
- Limited amount of time to finish the project (2 months – extended to 3 months for Covid19)
- Limited amount of resources. The user research team of one.
- Location – Company located in Spain.
STEP OF WORK
STEP 1. GENERATIVE RESEARCH
My first goal was to try to collect as much information as possible about users to help me identify potential users and their level of understanding with technology, pain points & frustrations, needs and wants.
From a quantitative point of view, I started with desk research, collecting information and data points about consumers’ needs and factors that influence their decisions. I found several research studies from local government about the number of rural tourists in every region, the reasons why they travel and which kind of accommodation they choose. On the other hand, the company didn’t have any kind of tool to collect quantitative data about online users from their website so I started setting up Google Analytics accounts.
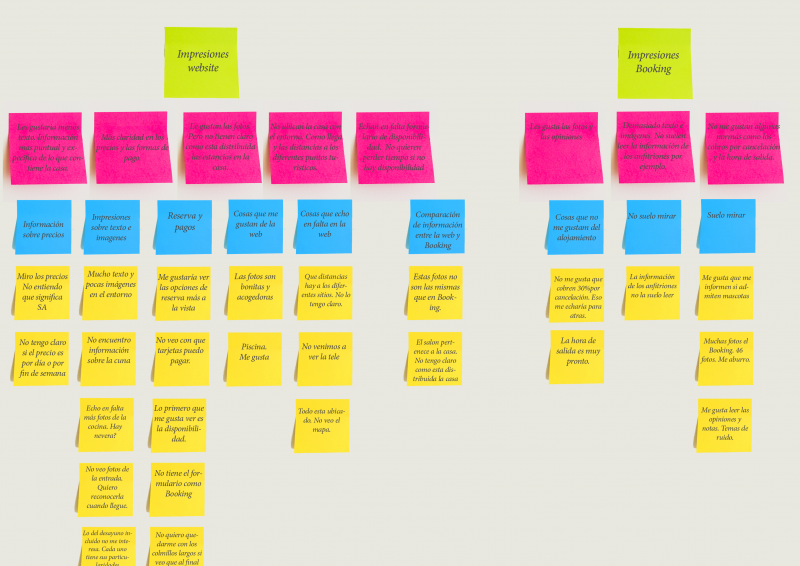
To obtain qualitative insights, I ran 1 to 1 discussion with 3 potential users – uncovering the why behind their behaviours, thoughts and emotions. With the data obtained I created an Affinity Map.
STEP 2. COMPETITIVE ANALYSIS
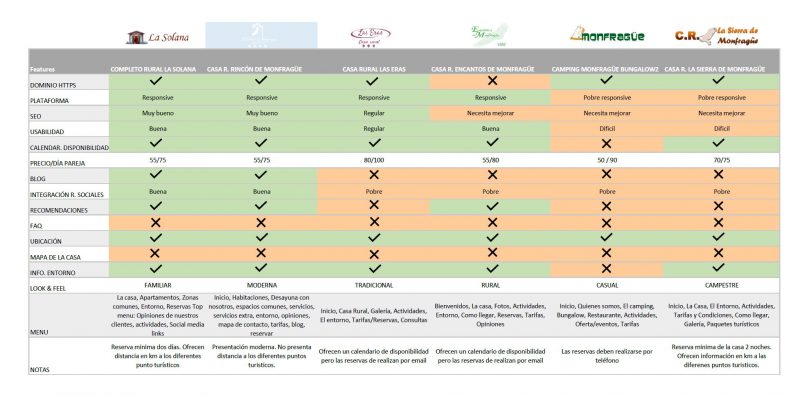
To understand our position in the market I carried out a competitor analysis to see what services are offered and what information is more common in our competitors’ websites.
With the data collected from this analysis, I created a positioning map to show where the company wishes to be relative to the competition.
STEP 3. DEVELOP HYPOTHESES
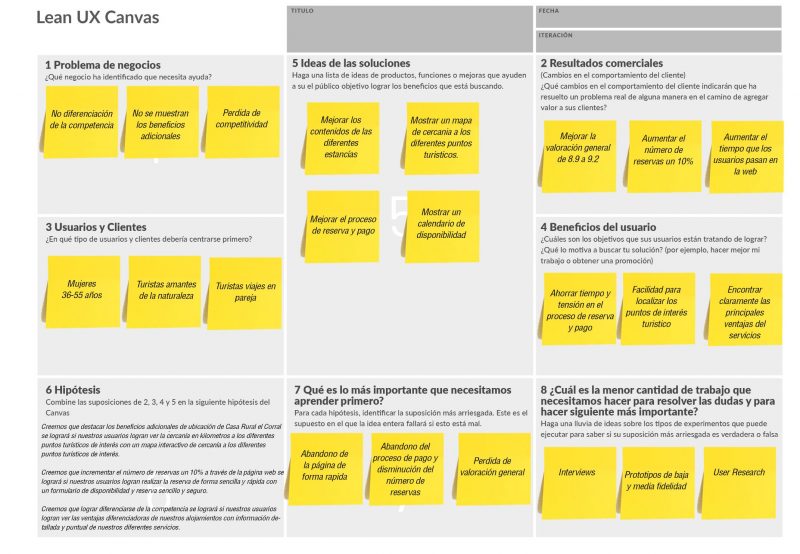
With the data obtained I analysed the business problems, prioritised them and generated hypotheses that could be tested later on.
I collated them in a Lean UX Canvas.
Keeping the stakeholders informed and involved in the process was really important for me because I could show the advantage of conducting user research first hand. Having them on the side helped me to get some tasks done quicker like recruiting participants for the Usability test. For this reason, I created a presentation with an overview of the findings for my stakeholders and talked about the next steps.
STEP 5. DEVELOP PERSONAS
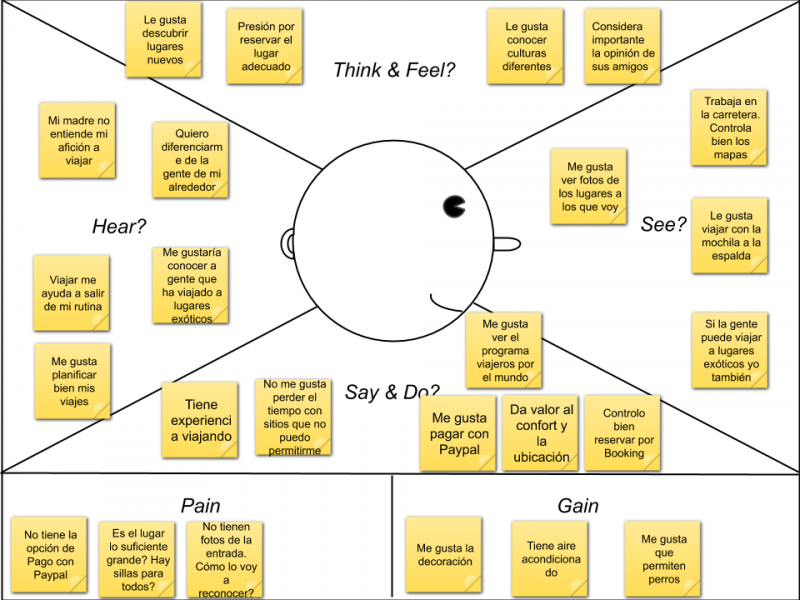
To be able to give structure to all the information collected in the generative research and maintain focus on users needs I created an Empathy Map. This helped to create Personas. My main persona is Laura.
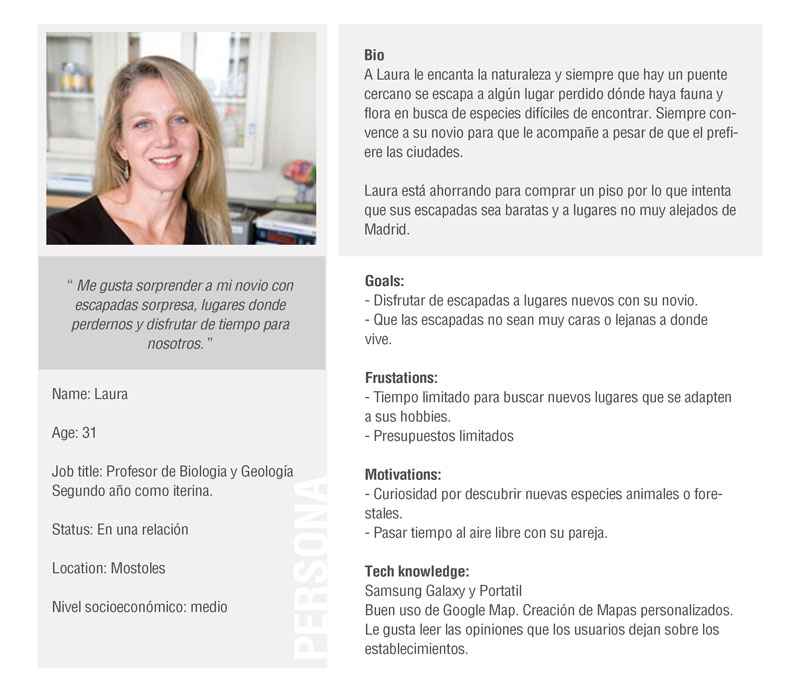
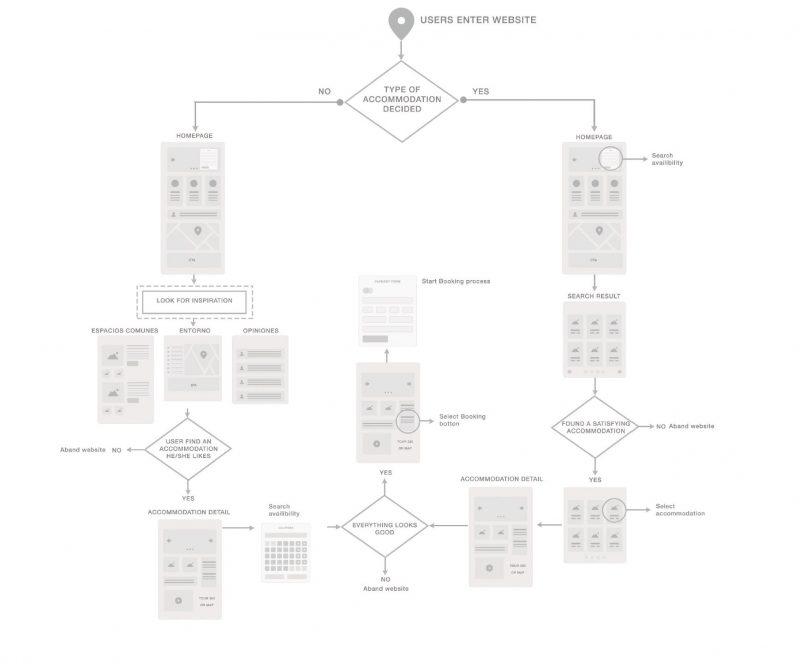
After creating my first persona, I explored and defined the paths that my persona might take through the website to achieve her goal. For that I created a User Flow to have a clear picture of the journey a user persona may take when navigating the website.
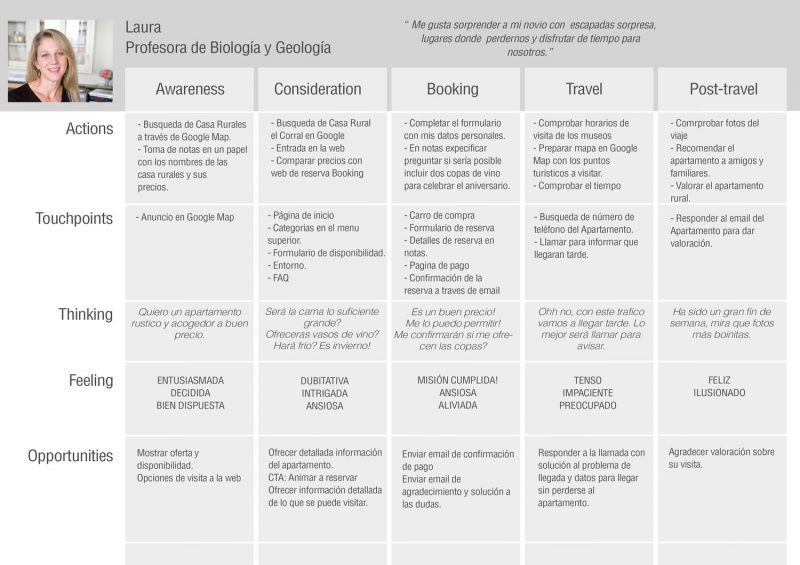
The conclusions of the User flow helped me to create a more robust Customer Journey Map. With the Customer Journey map I intended to see a bigger picture and make better decisions about where to prioritise work.
STEP 6. PRIORITISE FEATURES
The next step in the process was to give a structure to the website based on the Customer Journey Map. I started by defining the minimum requirements or deliverables for the website by drafting the User Stories. I can identify three user types: new user, returning user and all users.
| User Type | User Story | Reason |
| As a new user | I want to find an accommodation close to my main tourist’s point | As I want to able to see all the tourist places around the area. |
| As a new user | I want to find availability and prices for my next trip | I want to book accommodation for my next holidays. |
| As a returning user | I want to find special offers | For further booking |
| As a returning user | I want to buy a gift card | As I want give this experience to some relatives. |
| All users | I want to compare 2 or more prices for accommodation around the area | This will help me decide quickly which accommodation offer better prices. |
| All users | I want to see the distance between the tourist places | This will help me decide the best location to book an accommodation. |
STEP 7. SKETCH IDEAS AND PROTOTYPING
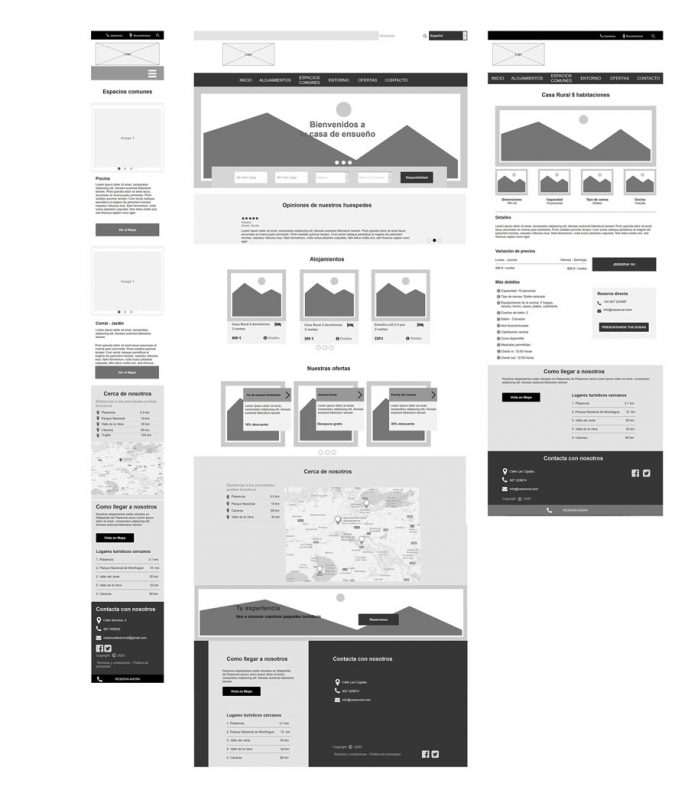
I started with very rough sketches, to get all my ideas out quickly.
After that, I drew out the main flow screens and began prototyping them with Axure.
STEP 8. USABILITY TESTING
When I finished I tested mid-wireframes with 3 users in person. I asked the user to complete a series of tasks to ascertain how well the prototype performed and acknowledge potential problems in the website.
I discovered some confusion with one of the menu titles and some information missing. To amend the potential problems I ran a meeting with the stakeholders to present the overall user performance and discuss the problems.
STEP 9. BUILD WEBSITE
I developed the website with WordPress. I created the website following the design of the prototypes and focused on making the functionality as good as possible.
STEP 10. TEST
When the website was almost finished I ran a Monitored Remote Usability test with 4 users to analyse the effectiveness, efficiency, and satisfaction of the website. At the same time,
I re-configurated the analytics tool to get more accurate data and understand future behavioural trends or patterns.
OUTCOMES
The results were encouraging, with a very positive completion rate, high overall relative efficiency and excellent score in the System Usability Scale. Although it’s early to draw solid conclusions given the short length of time the website has been live, the website analytics data is already starting to show some positive trends relative to the old website, such as conversion rates.
The stakeholders were really happy with the new website, not only for the positive satisfaction from the users but also the improved usability of the backend of the website, allowing them to make their own changes and consequently save cost and time taken for amendments.
REFLECTION
I achieved a deeper understanding of the best way to use different methodologies and tools in UX. I also became more confident in interviewing users and learned how to refine my approach and obtain more information from each session.
Some of the stakeholder engagement has been quite challenging, however. The initial excitement and proactive support I received working in an User Centred design approach waned slightly, and I faced more resistance before the second Usability test. Their need to get the website live quickly made them forget about the benefits of conducting Usability testing. However, showing them the conclusion of the Usability testing and getting them involved in solving the potential problems helped me to gain credibility and their support during the rest of the project.